October 2026 Townhome Market Update: What Surrey Buyers and Sellers Should Know.
Surrey Townhome Market Update: October 2026
Townhome prices softened across the Fraser Valley in October, while sales increased from September. For people planning to buy or sell a townhome in Surrey, the latest figures provide useful context—but neighbourhood and complex-level comparisons remain essential.
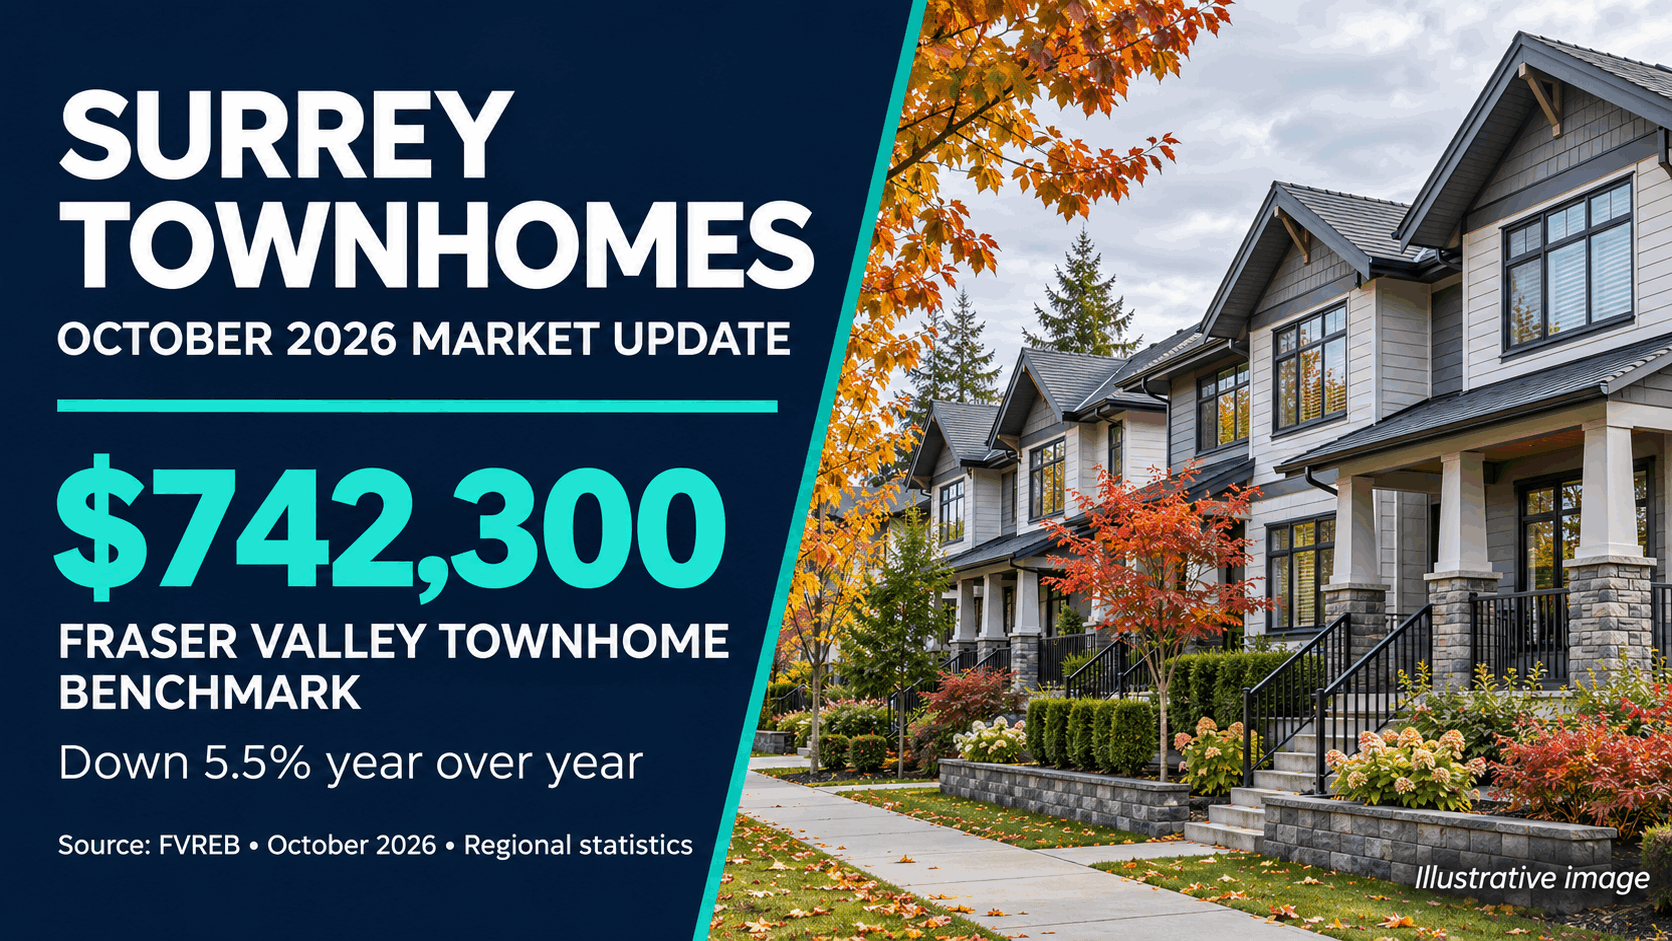
The Fraser Valley townhome benchmark price reached $742,300, down 0.4% from September and 5.5% from October 2025. There were 258 townhome sales during the month, with 1,502 active listings.
These figures cover the entire Fraser Valley Real Estate Board region, rather than Surrey alone. Here is how to interpret them when considering your next move in Surrey.
October 2026 Townhome Market at a Glance
| Measure | October 2026 | Change from September | Change from October 2025 |
|---|---|---|---|
| Benchmark price | $742,300 | −0.4% | −5.5% |
| Sales | 258 | +14.7% | −17.6% |
| Active listings | 1,502 | −7.9% | −12.8% |
| New listings | 527 | −15.8% | −16.6% |
Townhomes took an average of 37 days to sell across the FVREB region in October.
Source: Fraser Valley Real Estate Board, October 2026 MLS® Summary and Housing Market Snapshot. All figures above are regional townhome statistics.
Townhome Prices Declined as Monthly Sales Improved
October’s results show why one headline rarely tells the whole story.
The regional townhome benchmark price declined slightly from September, while the number of sales increased by 14.7%. However, sales remained 17.6% below October last year.
At the same time, fewer new townhomes came onto the market, and active inventory declined from both September and October 2025.
For Surrey buyers and sellers, the takeaway is that prices, sales and inventory can move in different directions. A busier month for sales does not necessarily mean prices are rising, just as lower prices do not mean every seller will accept a substantial discount.
Are Townhomes in a Buyer’s Market?
The overall Fraser Valley market was described as a buyer’s market in October, but the townhome segment had a different balance.
Townhomes recorded a sales-to-active listings ratio of approximately 17%, calculated by dividing 258 sales by 1,502 active listings. That falls within FVREB’s typical balanced-market range of 12% to 20%.
A balanced market does not mean every property receives equal attention. A well-presented townhome with competitive pricing may attract interest quickly, while another home in the same area may take longer.
The regional ratio is a starting point. Your price range, preferred neighbourhood and the competing homes in a specific complex will help determine the conditions you face.
What This Means for Surrey Townhome Buyers
A lower regional benchmark price gives buyers a reason to review their options. It does not establish the value of any individual Surrey townhome.
When comparing homes in Fleetwood, Clayton, Cloverdale, Sullivan Station or South Surrey, consider:
- Recent comparable sales: Look at similar homes in the same complex or nearby developments.
- Layout and usable space: Bedroom placement, stairs, storage and outdoor space can affect how well a home fits your needs.
- Parking: Confirm the number, type and allocation of parking spaces.
- Strata costs and documents: Review monthly fees, financial information, meeting minutes, depreciation reports and any disclosed special levies.
- Condition and upcoming work: Consider both the unit’s condition and the maintenance needs of the complex.
October’s regional average of 37 days to sell also provides context, but it is not a deadline or a prediction for a particular property.
Searching Within Your Budget
Start by comparing homes that fit your financing and monthly ownership budget. Include strata fees, property taxes, insurance and utilities alongside your mortgage payment.
You can explore these Surrey townhome searches:
Availability changes, and homes within the same price range can differ considerably in size, condition, tenure and strata arrangements.
What This Means for Surrey Townhome Sellers
With regional benchmark prices below last year’s level, sellers should build their pricing strategy around current comparable sales and active competition.
A price based mainly on what a neighbour received in a different market may not reflect today’s buyer choices.
Before listing, review three things:
- What has sold recently? Completed sales provide evidence of what buyers have been willing to pay.
- What will buyers compare your home against? Active listings help show where your property will sit in the current selection.
- How will your home be presented? Preparation, photography, clear property information and marketing help buyers understand its features.
The goal is to make the home’s value clear from the beginning. Review showing activity and feedback after launch so your strategy can respond to the market.
Why Surrey Neighbourhood Statistics Matter
Surrey’s townhome market includes a wide range of properties. Older complexes, newer developments, larger family layouts and smaller entry-level homes do not all compete for the same buyers.
Regional statistics help explain the broader direction of the market. A useful buying or selling decision also needs a closer comparison of the neighbourhood, complex, age, size, condition and price range involved.
For example, the $742,300 regional benchmark is not a Surrey-wide average sale price, and it should not be used as an automatic valuation for your home.
Planning to Buy or Sell a Surrey Townhome?
October’s figures show softer regional prices alongside an increase in monthly townhome sales. For buyers, that makes careful comparison worthwhile. For sellers, it reinforces the importance of pricing against current competition.
If you would like to understand what is happening in your Surrey neighbourhood or townhome complex, contact me for a local market breakdown.
Browse Surrey townhomes at www.surreytownhomesforsale.com.
Chris Yorke Personal Real Estate Corporation
eXp Realty
Phone: 604.916.6794
Email: cy@chrisyorke.com
Source: Fraser Valley Real Estate Board, October 2026 Statistics Package, MLS® Summary and Housing Market Snapshot. Statistics quoted in this article cover townhomes across the FVREB region unless otherwise stated. MLS® HPI benchmark prices represent typical properties and are not average or median sale prices. Individual property values and local market conditions vary.
Categories
Recent Posts